


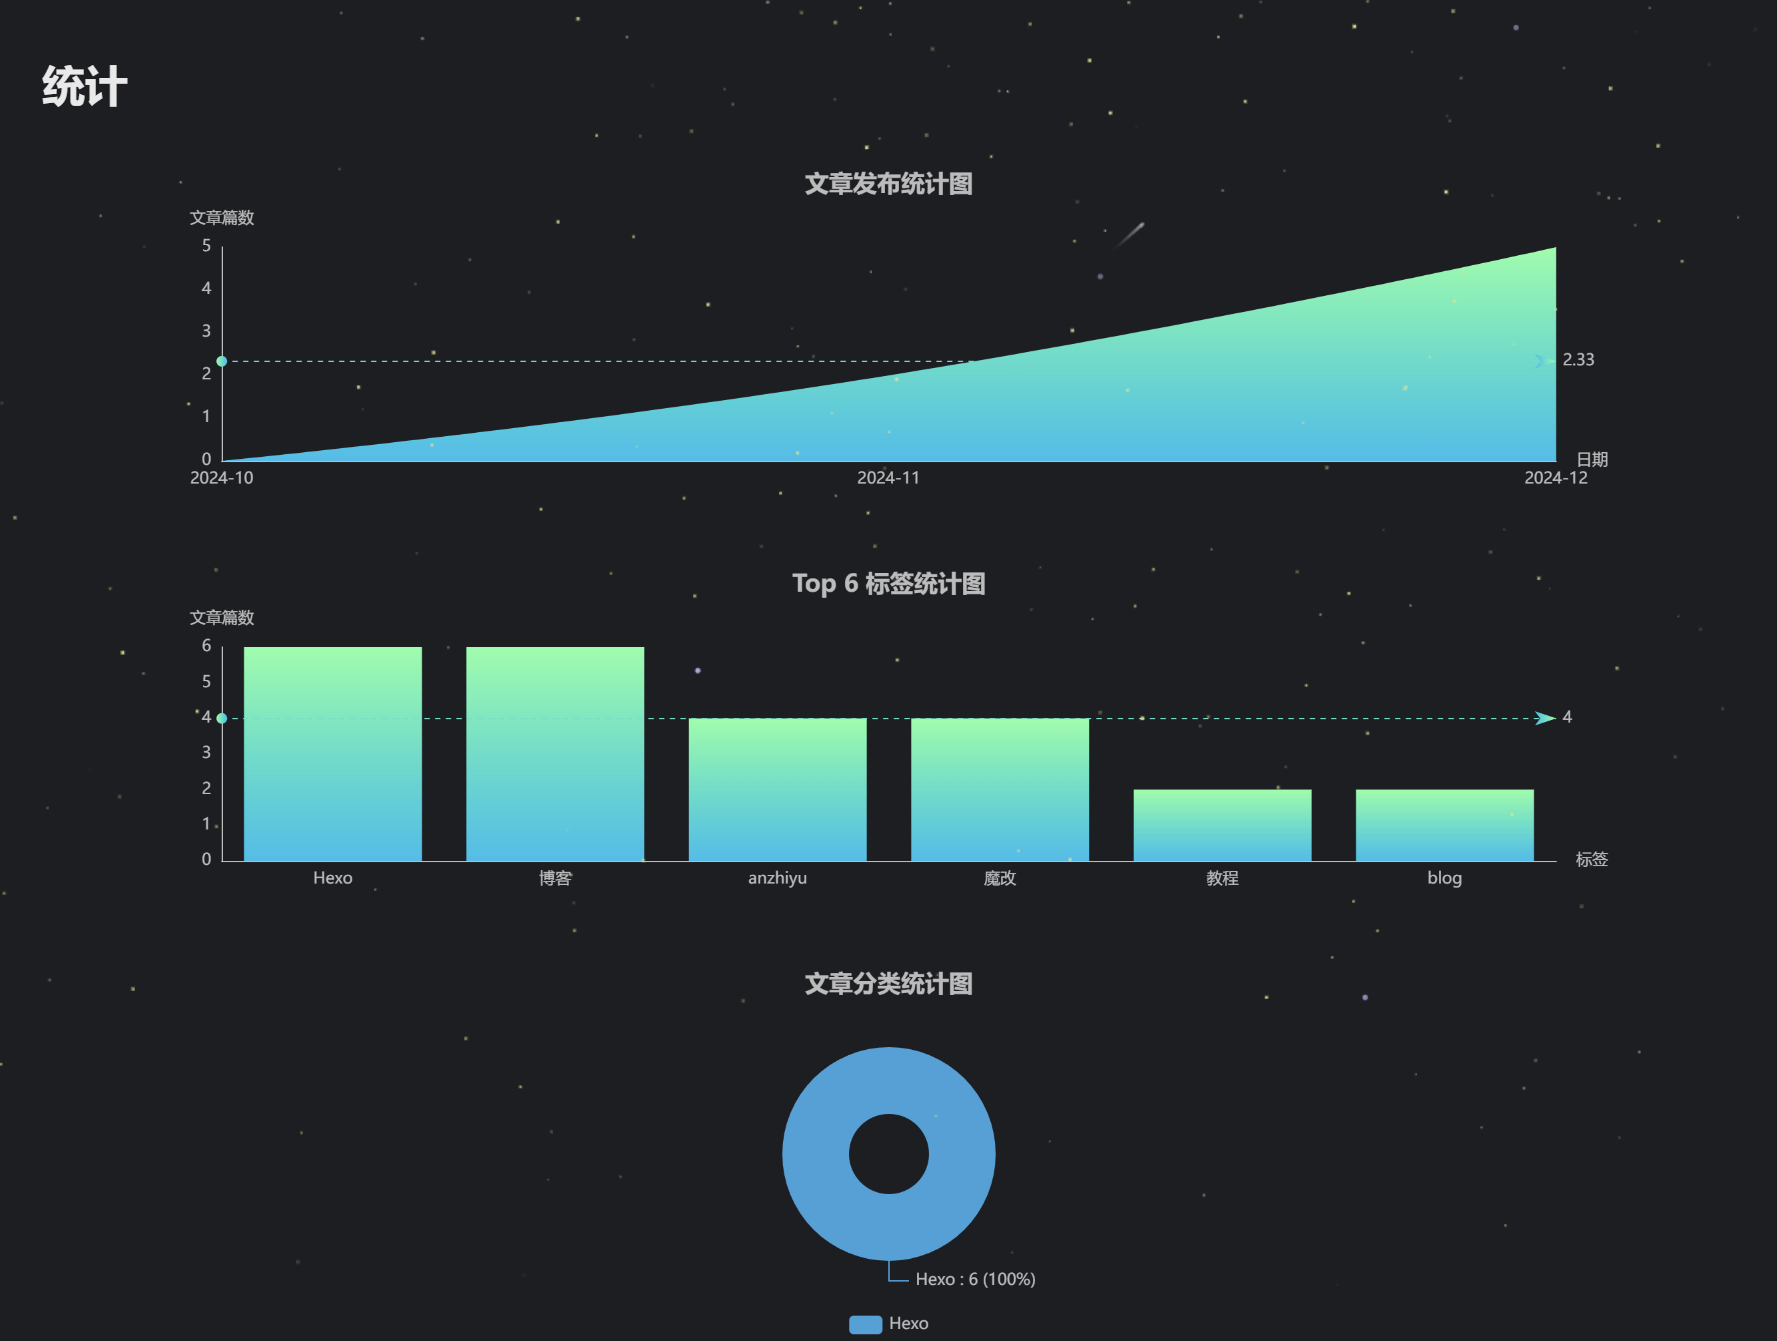
给博客添加文章统计页面
原文出自 Eurkon
效果展示
修改步骤
1、安装插件
npm i cheerio -save
2、新建charts.js文件
在 [Blog]\themes\anzhiyu\scripts\helpers\ 路线下新建一个 charts.js 文件,并将以下内容添加到文件中
// charts.js
const cheerio = require('cheerio')
const moment = require('moment')
hexo.extend.filter.register('after_render:html', function (locals) {
const $ = cheerio.load(locals)
const post = $('#posts-chart')
const tag = $('#tags-chart')
const category = $('#categories-chart')
const htmlEncode = false
if (post.length > 0 || tag.length > 0 || category.length > 0) {
if (post.length > 0 && $('#postsChart').length === 0) {
if (post.attr('data-encode') === 'true') htmlEncode = true
post.after(postsChart(post.attr('data-start')))
}
if (tag.length > 0 && $('#tagsChart').length === 0) {
if (tag.attr('data-encode') === 'true') htmlEncode = true
tag.after(tagsChart(tag.attr('data-length')))
}
if (category.length > 0 && $('#categoriesChart').length === 0) {
if (category.attr('data-encode') === 'true') htmlEncode = true
category.after(categoriesChart(category.attr('data-parent')))
}
if (htmlEncode) {
return $.root().html().replace(/&#/g, '&#')
} else {
return $.root().html()
}
} else {
return locals
}
}, 15)
function postsChart (startMonth) {
const startDate = moment(startMonth || '2020-01')
const endDate = moment()
const monthMap = new Map()
const dayTime = 3600 * 24 * 1000
for (let time = startDate; time <= endDate; time += dayTime) {
const month = moment(time).format('YYYY-MM')
if (!monthMap.has(month)) {
monthMap.set(month, 0)
}
}
hexo.locals.get('posts').forEach(function (post) {
const month = post.date.format('YYYY-MM')
if (monthMap.has(month)) {
monthMap.set(month, monthMap.get(month) + 1)
}
})
const monthArr = JSON.stringify([...monthMap.keys()])
const monthValueArr = JSON.stringify([...monthMap.values()])
return `
<script id="postsChart">
var color = document.documentElement.getAttribute('data-theme') === 'light' ? '#4c4948' : 'rgba(255,255,255,0.7)'
var postsChart = echarts.init(document.getElementById('posts-chart'), 'light');
var postsOption = {
title: {
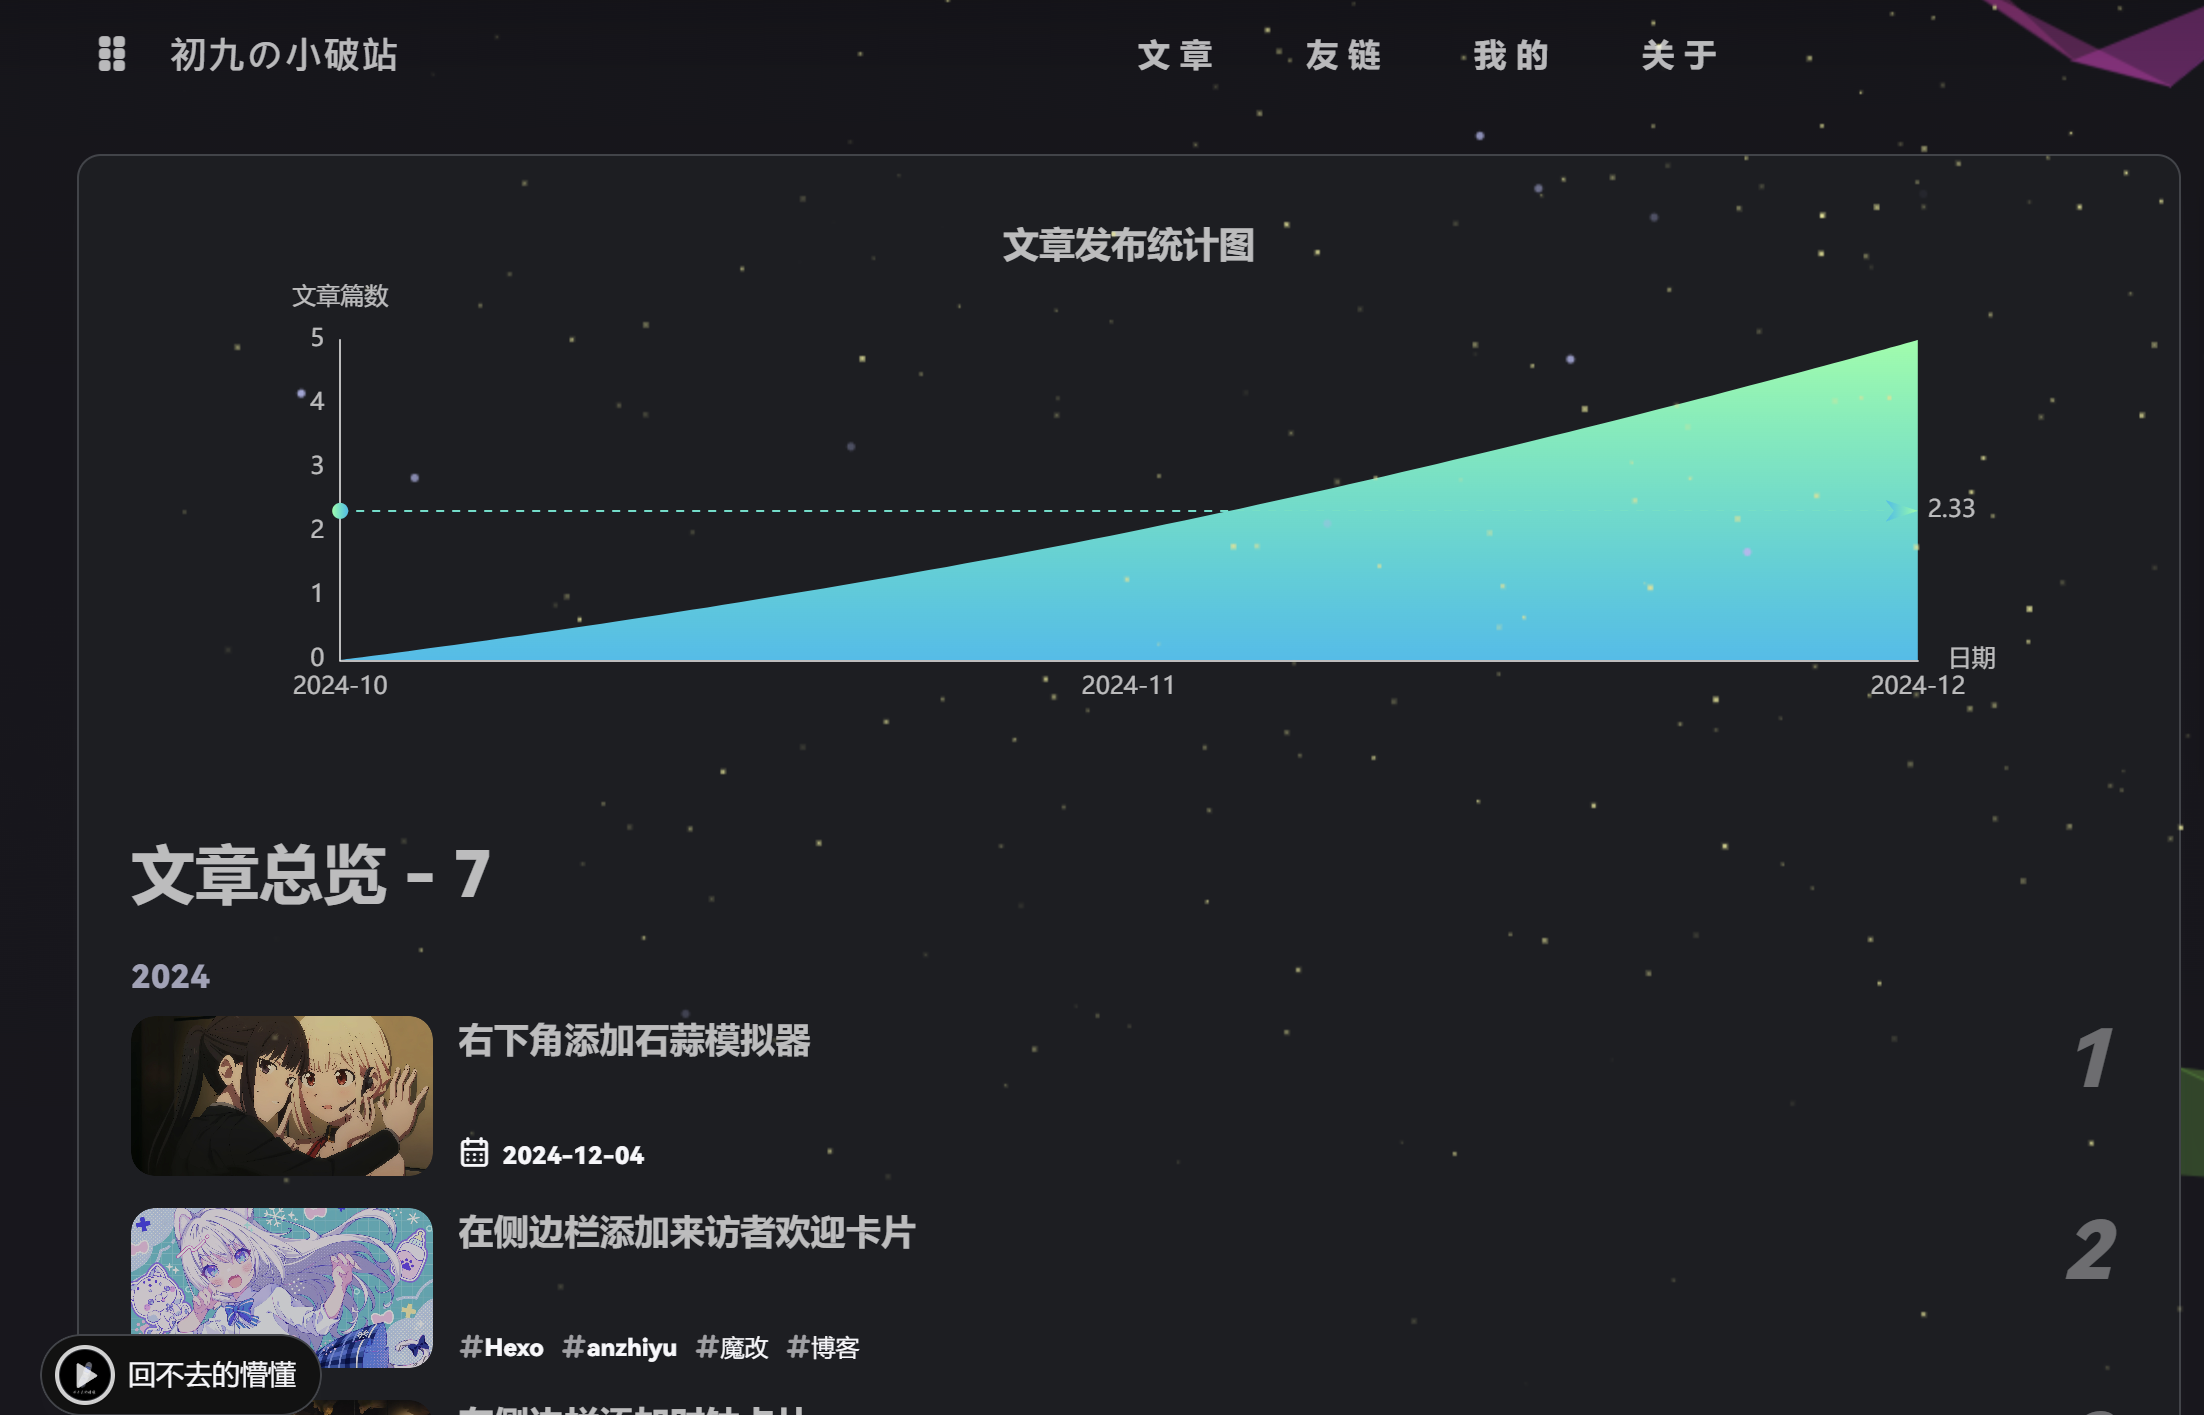
text: '文章发布统计图',
x: 'center',
textStyle: {
color: color
}
},
tooltip: {
trigger: 'axis'
},
xAxis: {
name: '日期',
type: 'category',
boundaryGap: false,
nameTextStyle: {
color: color
},
axisTick: {
show: false
},
axisLabel: {
show: true,
color: color
},
axisLine: {
show: true,
lineStyle: {
color: color
}
},
data: ${monthArr}
},
yAxis: {
name: '文章篇数',
type: 'value',
nameTextStyle: {
color: color
},
splitLine: {
show: false
},
axisTick: {
show: false
},
axisLabel: {
show: true,
color: color
},
axisLine: {
show: true,
lineStyle: {
color: color
}
}
},
series: [{
name: '文章篇数',
type: 'line',
smooth: true,
lineStyle: {
width: 0
},
showSymbol: false,
itemStyle: {
opacity: 1,
color: new echarts.graphic.LinearGradient(0, 0, 0, 1, [{
offset: 0,
color: 'rgba(128, 255, 165)'
},
{
offset: 1,
color: 'rgba(1, 191, 236)'
}])
},
areaStyle: {
opacity: 1,
color: new echarts.graphic.LinearGradient(0, 0, 0, 1, [{
offset: 0,
color: 'rgba(128, 255, 165)'
}, {
offset: 1,
color: 'rgba(1, 191, 236)'
}])
},
data: ${monthValueArr},
markLine: {
data: [{
name: '平均值',
type: 'average',
label: {
color: color
}
}]
}
}]
};
postsChart.setOption(postsOption);
window.addEventListener('resize', () => {
postsChart.resize();
});
postsChart.on('click', 'series', (event) => {
if (event.componentType === 'series') window.location.href = '/archives/' + event.name.replace('-', '/');
});
</script>`
}
function tagsChart (len) {
const tagArr = []
hexo.locals.get('tags').map(function (tag) {
tagArr.push({ name: tag.name, value: tag.length, path: tag.path })
})
tagArr.sort((a, b) => { return b.value - a.value })
const dataLength = Math.min(tagArr.length, len) || tagArr.length
const tagNameArr = []
for (let i = 0; i < dataLength; i++) {
tagNameArr.push(tagArr[i].name)
}
const tagNameArrJson = JSON.stringify(tagNameArr)
const tagArrJson = JSON.stringify(tagArr)
return `
<script id="tagsChart">
var color = document.documentElement.getAttribute('data-theme') === 'light' ? '#4c4948' : 'rgba(255,255,255,0.7)'
var tagsChart = echarts.init(document.getElementById('tags-chart'), 'light');
var tagsOption = {
title: {
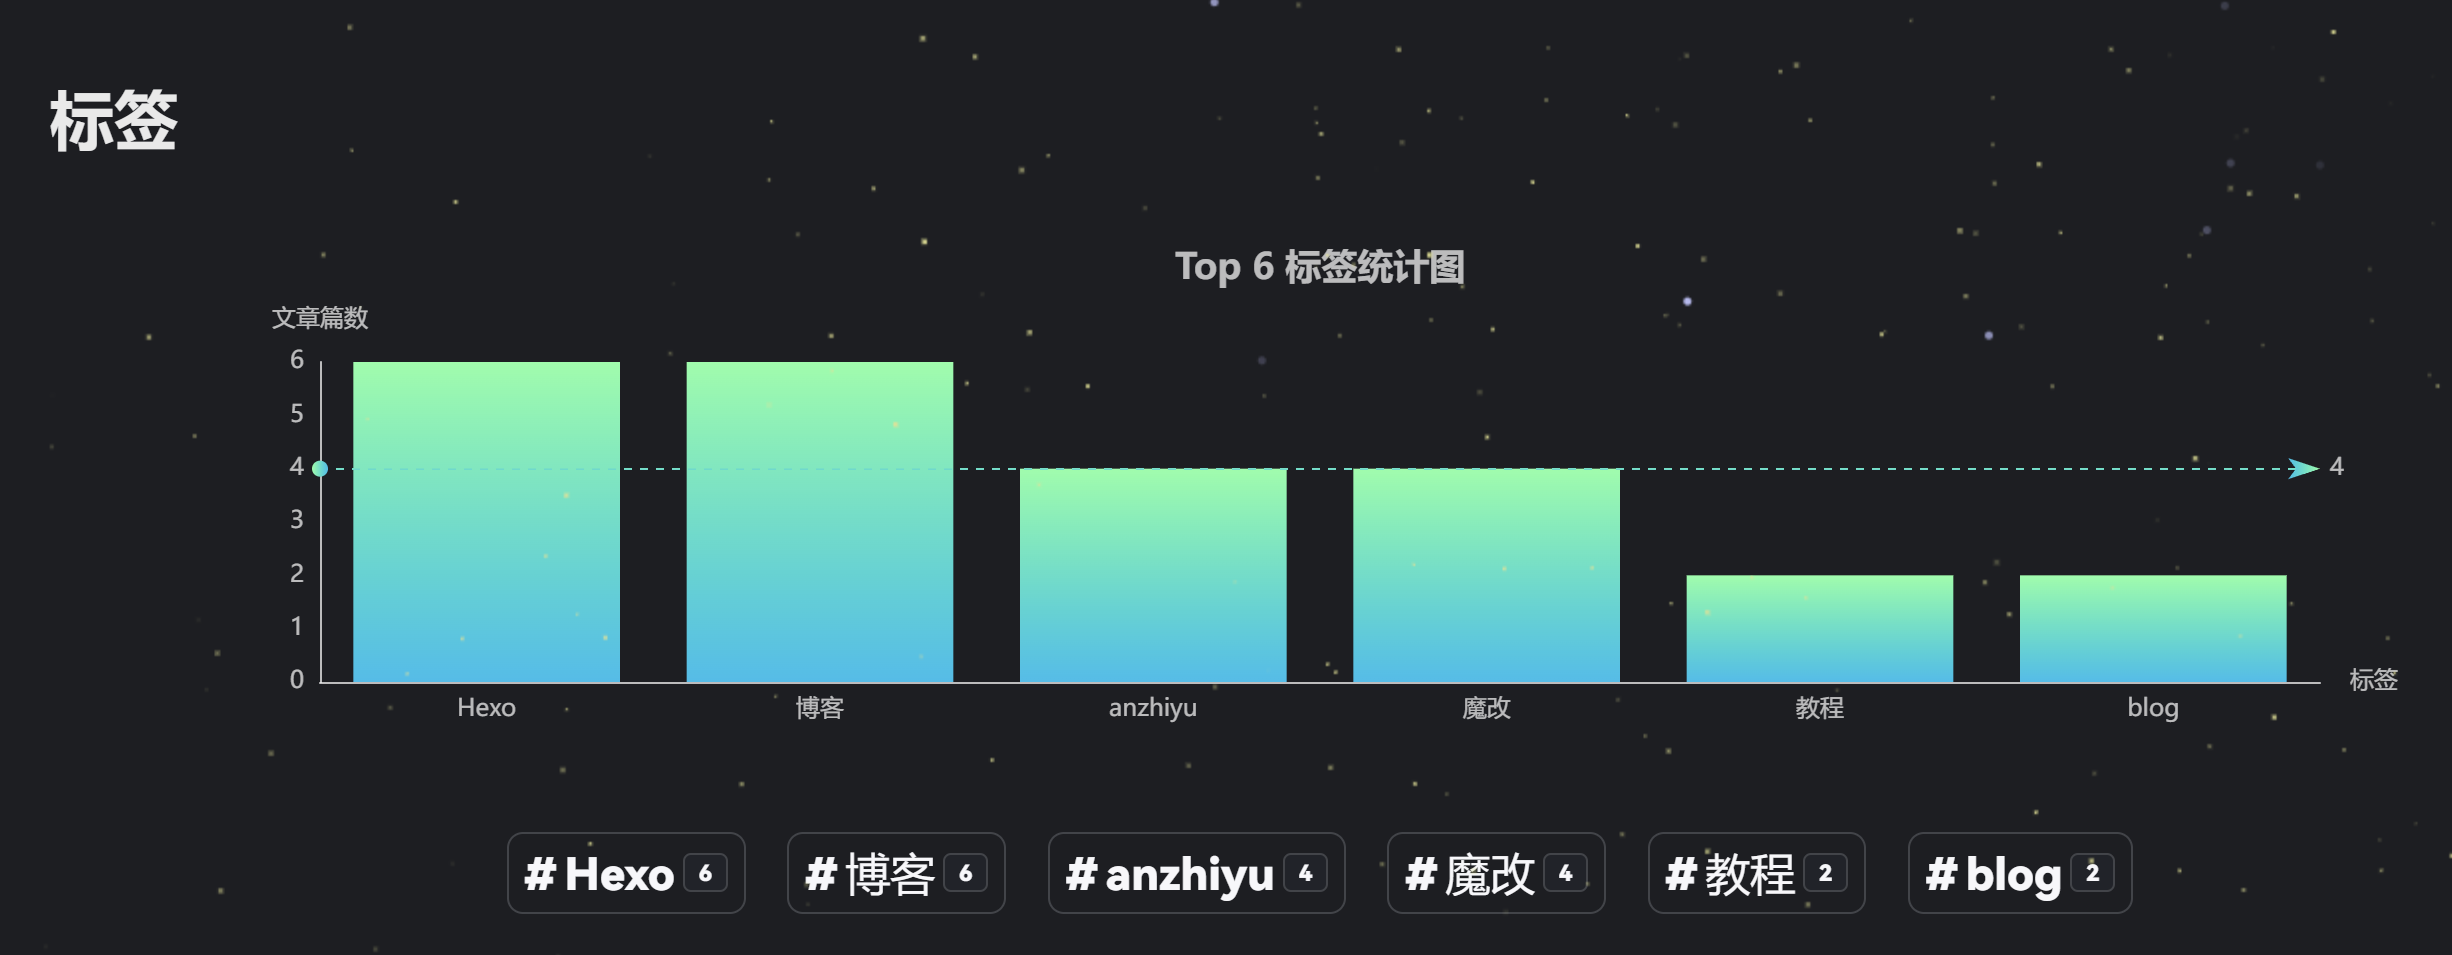
text: 'Top ${dataLength} 标签统计图',
x: 'center',
textStyle: {
color: color
}
},
tooltip: {},
xAxis: {
name: '标签',
type: 'category',
nameTextStyle: {
color: color
},
axisTick: {
show: false
},
axisLabel: {
show: true,
color: color,
interval: 0
},
axisLine: {
show: true,
lineStyle: {
color: color
}
},
data: ${tagNameArrJson}
},
yAxis: {
name: '文章篇数',
type: 'value',
splitLine: {
show: false
},
nameTextStyle: {
color: color
},
axisTick: {
show: false
},
axisLabel: {
show: true,
color: color
},
axisLine: {
show: true,
lineStyle: {
color: color
}
}
},
series: [{
name: '文章篇数',
type: 'bar',
data: ${tagArrJson},
itemStyle: {
borderRadius: [5, 5, 0, 0],
color: new echarts.graphic.LinearGradient(0, 0, 0, 1, [{
offset: 0,
color: 'rgba(128, 255, 165)'
},
{
offset: 1,
color: 'rgba(1, 191, 236)'
}])
},
emphasis: {
itemStyle: {
color: new echarts.graphic.LinearGradient(0, 0, 0, 1, [{
offset: 0,
color: 'rgba(128, 255, 195)'
},
{
offset: 1,
color: 'rgba(1, 211, 255)'
}])
}
},
markLine: {
data: [{
name: '平均值',
type: 'average',
label: {
color: color
}
}]
}
}]
};
tagsChart.setOption(tagsOption);
window.addEventListener('resize', () => {
tagsChart.resize();
});
tagsChart.on('click', 'series', (event) => {
if(event.data.path) window.location.href = '/' + event.data.path;
});
</script>`
}
function categoriesChart (dataParent) {
const categoryArr = []
let categoryParentFlag = false
hexo.locals.get('categories').map(function (category) {
if (category.parent) categoryParentFlag = true
categoryArr.push({
name: category.name,
value: category.length,
path: category.path,
id: category._id,
parentId: category.parent || '0'
})
})
categoryParentFlag = categoryParentFlag && dataParent === 'true'
categoryArr.sort((a, b) => { return b.value - a.value })
function translateListToTree (data, parent) {
let tree = []
let temp
data.forEach((item, index) => {
if (data[index].parentId == parent) {
let obj = data[index];
temp = translateListToTree(data, data[index].id);
if (temp.length > 0) {
obj.children = temp
}
if (tree.indexOf())
tree.push(obj)
}
})
return tree
}
const categoryNameJson = JSON.stringify(categoryArr.map(function (category) { return category.name }))
const categoryArrJson = JSON.stringify(categoryArr)
const categoryArrParentJson = JSON.stringify(translateListToTree(categoryArr, '0'))
return `
<script id="categoriesChart">
var color = document.documentElement.getAttribute('data-theme') === 'light' ? '#4c4948' : 'rgba(255,255,255,0.7)'
var categoriesChart = echarts.init(document.getElementById('categories-chart'), 'light');
var categoryParentFlag = ${categoryParentFlag}
var categoriesOption = {
title: {
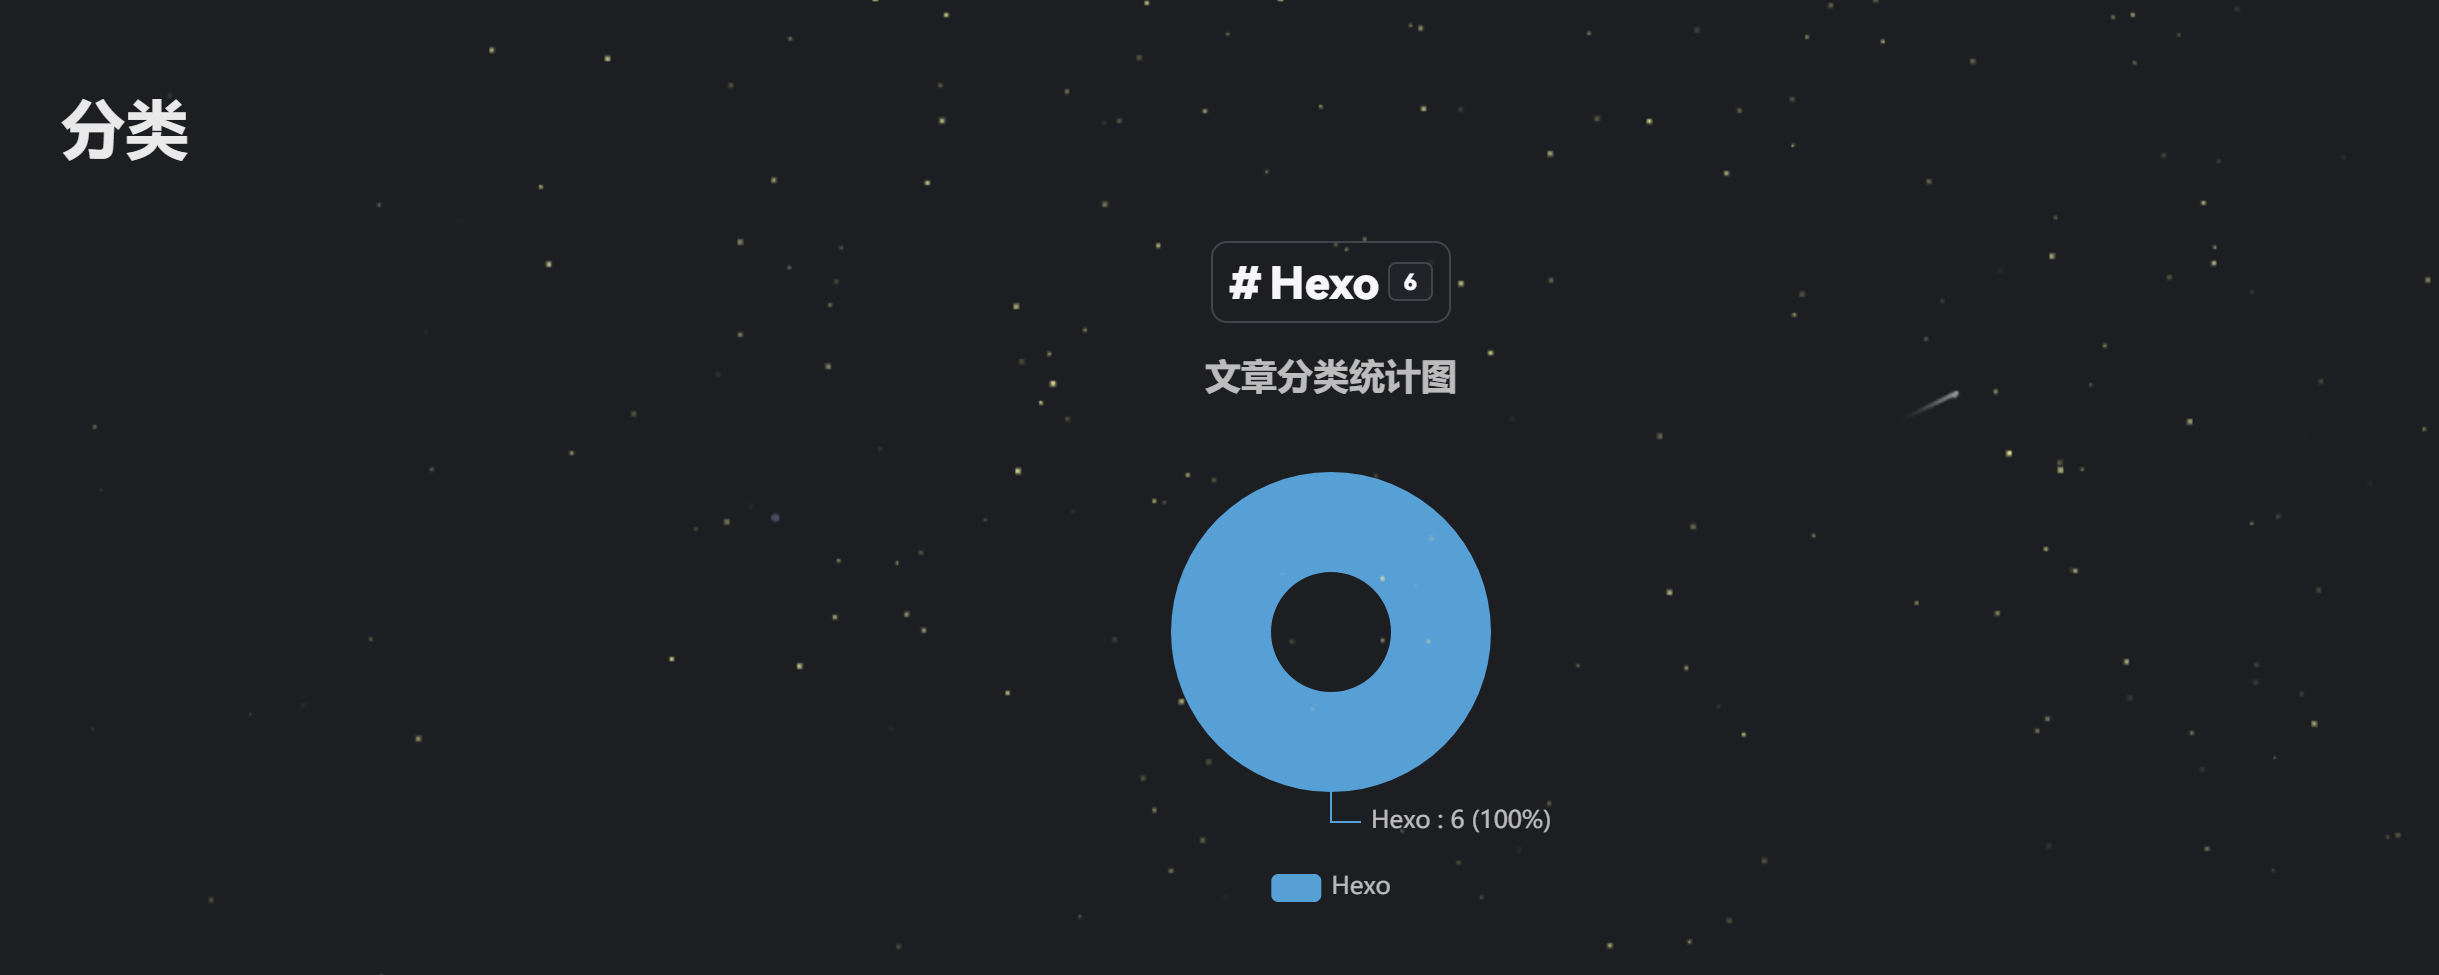
text: '文章分类统计图',
x: 'center',
textStyle: {
color: color
}
},
legend: {
top: 'bottom',
data: ${categoryNameJson},
textStyle: {
color: color
}
},
tooltip: {
trigger: 'item'
},
series: []
};
categoriesOption.series.push(
categoryParentFlag ?
{
nodeClick :false,
name: '文章篇数',
type: 'sunburst',
radius: ['15%', '90%'],
center: ['50%', '55%'],
sort: 'desc',
data: ${categoryArrParentJson},
itemStyle: {
borderColor: '#fff',
borderWidth: 2,
emphasis: {
focus: 'ancestor',
shadowBlur: 10,
shadowOffsetX: 0,
shadowColor: 'rgba(255, 255, 255, 0.5)'
}
}
}
:
{
name: '文章篇数',
type: 'pie',
radius: [30, 80],
roseType: 'area',
label: {
color: color,
formatter: '{b} : {c} ({d}%)'
},
data: ${categoryArrJson},
itemStyle: {
emphasis: {
shadowBlur: 10,
shadowOffsetX: 0,
shadowColor: 'rgba(255, 255, 255, 0.5)'
}
}
}
)
categoriesChart.setOption(categoriesOption);
window.addEventListener('resize', () => {
categoriesChart.resize();
});
categoriesChart.on('click', 'series', (event) => {
if(event.data.path) window.location.href = '/' + event.data.path;
});
</script>`
}
3、主题配置文件中引入JS文件
在 [Blog]\_config.anzhiyu.yml 文章中找到 inject ,在 bottom 下添加配置(删除 + 号即是正常缩进)
inject:
  head:

  bottom:
+    - <script src="https://lib.baomitu.com/echarts/4.9.0-rc.1/echarts.min.js"></script>
也可以在页面中直接添加这段代码,两种方法都可以
4、创建统计页面
hexo n page charts
修改 [Blog]\source\charts\index.md 文件,将全部内容替换掉,代码如下
---
title: 统计
type: "charts"
comments: false
aside: false
---

<script src="https://lib.baomitu.com/echarts/4.9.0-rc.1/echarts.min.js"></script>

<!-- 文章发布时间统计图 --> <!-- 2020-02是从2020年2月开始计算 -->
<div id="posts-chart" data-start="2020-02" style="border-radius: 8px; height: 300px; padding: 10px;"></div>
<!-- 文章标签统计图 --> <!-- data-length="10" 是显示的标签数量 -->
<div id="tags-chart" data-length="10" style="border-radius: 8px; height: 300px; padding: 10px;"></div>
<!-- 文章分类统计图 -->
<div id="categories-chart" data-parent="true" style="border-radius: 8px; height: 300px; padding: 10px;"></div>
进阶
1、在归档页添加统计图
修改 [Blog]\themes\anzhiyu\layout\archive.pug 文件,删除 + 号即是正常所缩进
extends includes/layout.pug

block content
  include ./includes/mixins/article-sort.pug
  #archive
+    <div id="posts-chart" data-start="2024-10" style="border-radius: 8px; height: 300px; padding: 10px;"></div>
2、在分类页添加统计图
修改 [Blog]\themes\anzhiyu\layout\includes\page\categories.pug 文件,删除 + 号即是正常所缩进
#tag
+  <div id="categories-chart" data-parent="true" style="border-radius: 8px; height: 300px; padding: 10px;"></div>
  .category-lists#tag-page-tags!= tags_page_list("categories")
修改 [Blog]\themes\anzhiyu\layout\category.pug 文件,删除 + 号即是正常所缩进
block content
  if theme.category_ui == 'index'
    include ./includes/mixins/post-ui.pug
    #recent-posts.recent-posts.category_ui
      +postUI
      include includes/pagination.pug
  else
    include ./includes/mixins/article-sort.pug
    #category
+      <div id="categories-chart" data-parent="true" style="border-radius: 8px; height: 300px; padding: 10px;"></div>
3、在标签页添加统计图
修改 [Blog]\themes\anzhiyu\layout\includes\page\tags.pug 文件,删除 + 号即是正常所缩进
 .tag-cloud-list.is-center
+ <div id="tags-chart" data-length="10" style="border-radius: 8px; height: 300px; padding: 10px;"></div>
   #tag
     #tag-page-tags
       !=tags_page_list("tags")
修改 [Blog]\themes\anzhiyu\layout\tag.pug 文件,删除 + 号即是正常所缩进
block content
  if theme.tag_ui == 'index'
    include ./includes/mixins/post-ui.pug
    #recent-posts.recent-posts
      +postUI
      include includes/pagination.pug
  else
    include ./includes/mixins/article-sort.pug
    #tag
+      <div id="tags-chart" data-length="10" style="border-radius: 8px; height: 300px; padding: 10px;"></div>
- 感谢你赐予我前进的力量
-
 微信
微信  支付宝
支付宝
赞赏者名单
因为你们的支持让我意识到写文章的价值🙏
本文是原创文章,采用 CC BY-NC-ND 4.0 协议,完整转载请注明来自 初九の小破站
阅读建议


评论
隐私政策
你无需删除空行,直接评论以获取最佳展示效果


